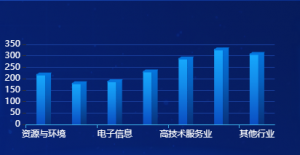
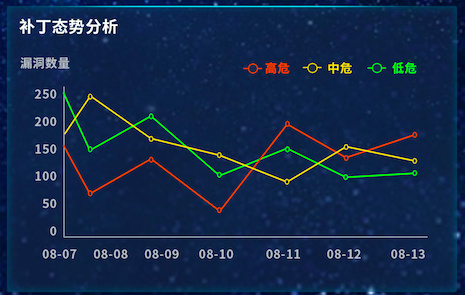
一、效果如下

二、前台代码
<div id="keshang" style="width: 100%;height: 230px;"></div>
三、引用的JS
<script type="text/javascript" src="js/jquery-3.3.1.min.js" charset="utf-8"></script>
<script src="js/echarts.min.js" type="text/javascript" ></script>
四、3D立体效果的JS
//客户分布
var myChart = echarts.init(document.getElementById('keshang'));
const data = [220, 182, 191, 234, 290, 330, 310]
const sideData = data.map(item => item + 4.5)
option = {
    tooltip: {
        trigger: 'axis',
        formatter: "{b} : {c}",
        axisPointer: { // 坐标轴指示器,坐标轴触发有效
        type: 'shadow' // 默认为直线,可选为:'line' | 'shadow'
        }
    },
    xAxis: {
        data: ['资源与环境', '高新技术', '电子信息', '航空航天', '高技术服务业', '新能源及节能', '其他行业'],
        //坐标轴
        axisLine: {
            lineStyle: {
                color: '#3eb2e8'
            }
        },
        //坐标值标注
        axisLabel: {
            show: true,
            textStyle: {
                color: '#fff',
            }
        }
    },
    yAxis: {
        //坐标轴
        axisLine: {
            show: false
        },
        //坐标值标注
        axisLabel: {
            show: true,
            textStyle: {
                color: '#fff',
            }
        },
        //分格线
        splitLine: {
            lineStyle: {
                color: '#193f9e'
            }
        }
    },
    series: [{
        name: 'a',
        tooltip: {
            show: false
        },
        type: 'bar',
        barWidth: 12,
        itemStyle: {
            normal: {
                color: new echarts.graphic.LinearGradient(0, 1, 0, 0, [{
                    offset: 0,
                    color: "#0B4EC3" // 0% 处的颜色
                }, {
                    offset: 0.6,
                    color: "#138CEB" // 60% 处的颜色
                }, {
                    offset: 1,
                    color: "#17AAFE" // 100% 处的颜色
                }], false)
            }
        },
        data: data,
        barGap: 0
    }, {
        type: 'bar',
        barWidth: 8,
        itemStyle: {
            normal: {
                color: new echarts.graphic.LinearGradient(0, 1, 0, 0, [{
                    offset: 0,
                    color: "#09337C" // 0% 处的颜色
                }, {
                    offset: 0.6,
                    color: "#0761C0" // 60% 处的颜色
                }, {
                    offset: 1,
                    color: "#0575DE" // 100% 处的颜色
                }], false)
            }
        },
        barGap: 0,
        data: sideData
    }, {
        name: 'b',
        tooltip: {
            show: false
        },
        type: 'pictorialBar',
        itemStyle: {
            normal: {
                color: new echarts.graphic.LinearGradient(0, 1, 0, 0, [{
                    offset: 0,
                    color: "#0575DE" // 0% 处的颜色
                }, {
                    offset: 0.6,
                    color: "#0575DE" // 60% 处的颜色
                }, {
                    offset: 1,
                    color: "#0575DE" // 100% 处的颜色
                }], false)
            }
        },
        symbol: 'path://M 0,0 l 120,0 l -30,60 l -120,0 z',
        symbolSize: ['22', '4'],
        symbolOffset: ['0', '-2'],
        //symbolRotate: -5,
        symbolPosition: 'end',
        data: data,
        z: 3
    }]
};
   myChart.setOption(option);


