【大数据】echarts大数据地图设置地图阴影,增加立体感以及在地图上打点
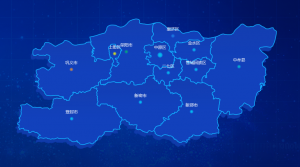
一、最终效果如下:
二、前台代码
<div id="echartMap" ></div>三、引用JS
3.1需要引用的JS
<script type="text/javascript" src="js/jquery-3.3.1.min.js" charset="utf-8"></script>
<script src="js/echarts.min.js" type="text/javascript" ></script>
<script src="js/vue.min.js" type="text/javascript" charset="utf-8"></script>
<script src="js/map.js" type="text/javascript"></script>
<script src="js/index2.js" type="text/javascript" charset="utf-8"></script>
前三个JS,可以通过网络直接下载,下面针对后两个JS进行分解
3.2 map.js
(function(root, factory) {
	if(typeof define === 'function' && define.amd) {
		// AMD. Register as an anonymous module.
		define(['exports', 'echarts'], factory);
	} else if(typeof exports === 'object' && typeof exports.nodeName !== 'string') {
		// CommonJS
		factory(exports, require('echarts'));
	} else {
		// Browser globals
		factory({}, root.echarts);
	}
}(this, function(exports, echarts) {
	var log = function(msg) {
		if(typeof console !== 'undefined') {
			console && console.error && console.error(msg);
		}
	}
	if(!echarts) {
		log('ECharts is not Loaded');
		return;
	}
	if(!echarts.registerMap) {
		log('ECharts Map is not loaded')
		return;
	}
	echarts.registerMap(
		'郑州', // 城市名称
		{"type":"FeatureCollection..."}
		// 直接替换json文件内的内容
	);
}));
需要替换的json数据,直接通过阿里云,参考我之前发的文章【大数据】DataV.GeoAtlas 全国GeoJSON数据(县区级)及应用
3.3 index2.js
var hotItemsVue = new Vue({
	el: '#index_box',
	data: {

	},
	created: function() {

	},
	components: {

	},
	methods: {

	},
	mounted: function() {
		echartMap();
	},
})


function echartMap() {
	// 基于准备好的dom,初始化echarts实例
	var myChart = echarts.init(document.getElementById('echartMap'));
	var app = {};
	option = null;
	//	myChart.showLoading();
	var points = [
	//	区域中心点位置及样式
	{
		"name": "中原区",
		"value": [113.546928, 34.780838, 2],
		"symbolSize": 10,
		"itemStyle": {
			"normal": {
				"color": "#01d4f9",
			}
		},
		symbolSize: 15,
	}, {
		"name": "二七区",
		"value": [113.594631, 34.678241, 2],
		"symbolSize": 10,
		"itemStyle": {
			"normal": {
				"color": "#01d4f9"
			}
		}
	}, {
		"name": "管城回族区",
		"value": [113.75524, 34.696862, 2],
		"symbolSize": 10,
		"itemStyle": {
			"normal": {
				"color": "#05d2fb"
			}
		}
	}, {
		"name": "金水区",
		"value": [113.743756, 34.810783, 2],
		"symbolSize": 10,
		"itemStyle": {
			"normal": {
				"color": "#05d2fb"
			}
		}
	}, {
		"name": "上街区",
		"value": [113.284108, 34.788622, 2],
		"symbolSize": 10,
		"itemStyle": {
			"normal": {
				"color": "#fbfc01"
			}
		}
	}, {
		"name": "惠济区",
		"value": [113.621348, 34.891191, 2],
		"symbolSize": 10,
		"itemStyle": {
			"normal": {
				"color": "#1e8ae8"
			}
		}
	}, {
		"name": "中牟县",
		"value": [114.004302, 34.713431, 2],
		"symbolSize": 10,
		"itemStyle": {
			"normal": {
				"color": "#00CED1",
			},
		}
	}, {
		"name": "巩义市",
		"value": [113.033344, 34.697305, 2],
		"symbolSize": 10,
		"itemStyle": {
			"normal": {
				"color": "#e79435",

			}
		}
	}, {
		"name": "荥阳市",
		"value": [113.351681, 34.799765, 2],
		"symbolSize": 10,
		"itemStyle": {
			"normal": {
				"color": "#01bb6e"
			}
		}
	}, {
		"name": "新密市",
		"value": [113.433255, 34.508082, 2],
		"symbolSize": 10,
		"itemStyle": {
			"normal": {
				"color": "#00dcff"
			}
		}
	}, {
		"name": "新郑市",
		"value": [113.729471, 34.453334, 2],
		"symbolSize": 10,
		"itemStyle": {
			"normal": {
				"color": "#00dcff"
			}
		}
	}, {
		"name": "登封市",
		"value": [113.035049, 34.412311, 2],
		"symbolSize": 10,
		"itemStyle": {
			"normal": {
				"color": "#00dcff"
			}
		}
	}];
	//	区域中心点位置
	var geoCoordMap = {
		'中原区': [113.546928, 34.780838],
	    '二七区': [113.594631, 34.678241],
	    '管城回族区': [113.75524, 34.696862],
	    '金水区': [113.743756, 34.810783],
	    '上街区': [113.284108, 34.788622],
	    '惠济区': [113.621348, 34.891191],
	    '中牟县': [114.004302, 34.713431],
	    '巩义市': [113.033344, 34.697305],
	    '荥阳市': [113.351681, 34.799765],
	    '新密市': [113.433255, 34.508082],
	    '新郑市': [113.729471, 34.453334],
	    '登封市': [113.035049, 34.412311],
	};
	//	区域数据调用
	var series = [{
			name: '郑州市',
			type: 'map',
			geoIndex: 2,
			map: '郑州', // 自定义扩展图表类型,
			aspectScale: 1,
			roam:false,
			data: [
				{
					name: '中原区',
					value: 2,
					today: 12,
					month: 255,
					year: 9665
				},
				{
					name: '二七区',
					value: 5,
					today: 13,
					month: 255,
					year: 9123665
				},{
					name: '管城回族区',
					value: 7,
					today: 192,
					month: 22325,
					year: 123665
				},{
					name: '金水区',
					value: 3,
					today: 123,
					month: 135,
					year: 161235
				},{
					name: '上街区',
					value: 6,
					today: 17,
					month: 2525,
					year: 961235
				},
				{
					name: '惠济区',
					value: 8,
					today: 42,
					month: 2532,
					year: 94365
				},
				{
					name: '中牟县',
					value: 4,
					today: 13,
					month: 255,
					year: 9123665
				},

				{
					name: '巩义市',
					value: 1,
					today: 132,
					month: 2525,
					year: 96665
				},
				{
					name: '荥阳市',
					value: 9,
					today: 22,
					month: 252,
					year: 9643565
				},
			],
			itemStyle: {
				normal: {
					areaColor: new echarts.graphic.LinearGradient(
						0, 0, 0, 1, [{
								offset: 0,
								color: 'rgba(30,83,227,1)' //	设置色块颜较浅
							},
							{
								offset: 0.5,
								color: 'rgba(30,83,227,1)'//	设置色块颜中等
							},
							{
								offset: 1,
								color: 'rgba(46,97,239,1)' //	设置色块颜较深
							}
						]
					), //'#fff' linear-gradient(to bottom right, red , blue);
					borderColor: '#0b9efb',
					borderWidth: 1,
					shadowBlur: 1,
					shadowColor: '#7cccff',
				},
				emphasis: {
					areaColor: '#053167'
				}
			},
			label: {
                normal: {
                    textStyle: {
                        fontSize: 14,
                        fontWeight: 'bold',
                        color: '#fff'
                    }
                }
            },
		},
		{
			type: 'scatter',
			coordinateSystem: 'geo',
			data: points,
			symbolSize: 10,
			symbol: 'circle',
			effect: {
				show: true,
				shadowBlur: 0
			},
			itemStyle: {
				normal: {
//					color: "red",
					borderColor: "rgba(23,68,199,0.5)",
					borderWidth: 5,
				}
			},
			label: {
				normal: {
					formatter: '{b}',
					position: 'top',
					show: true,
					color: "#fff"
				},
				emphasis: {
					show: true
				}
			},
		}
	];
	myChart.setOption(option = {
		tooltip: {
			show: true,
			formatter: function(params) {
				var html = "<span style='color:#fff'>" + params.data.name + "</span>" + "</br>项目数:" + params.data.today + "</br>载体数:" +
					params.data.month + "</br>客商数:" + params.data.year + "</br>";
				return [html].join('');
			},
		},
		geo: { //引入地图的文件,需要在map.js里面配置json数据
			map: '郑州',
			roam:false,
			zoom: 1,
			aspectScale: 1,
			itemStyle: {
				normal: {
					borderColor: '#6c8ae2', //	设置阴影边框
					shadowColor: '#1843b6', //	设置阴影颜色
					shadowBlur: 1,
					shadowOffsetY: 12, //	设置阴影宽度
					shadowOffsetX: 6,
				},
				emphasis: {
					areaColor: '#57baff'
				}
			},
		},
		series: series
	})
	myChart.setOption(option);
}


